

Newline Status Page
Overview
The Newline Status Page provides real-time and historical visibility into system health across all Newline services. It is publicly accessible and does not require authentication.
- Real-Time System Status: Current health of core products (API, Developer Tools, Dashboard)
- Uptime Overview: Availability over the past 90 days
- Scheduled Maintenance: Current and upcoming maintenance windows
- Past Incidents: Chronological incident log
- Subscription Options: Email, SMS, Slack, Microsoft Teams, Webhook, Atom, and RSS notifications
System Components
The Status Page provides visibility into the health of the following Newline services:
Core Services
- Newline API
Developer Tools
- Newline Dashboard
- Developer Documentation
Status Definitions
The Status Page uses the following statuses to communicate system health:
- Operational – The system is functioning normally
- Scheduled – A planned maintenance event has been announced
- In Progress – Maintenance or an incident is actively occurring
- Completed – The maintenance or incident has been resolved
System Status Overview
View the current overall health of Newline systems at the top of the Status Page.
- Overall Status Banner: e.g., "All Systems Operational"
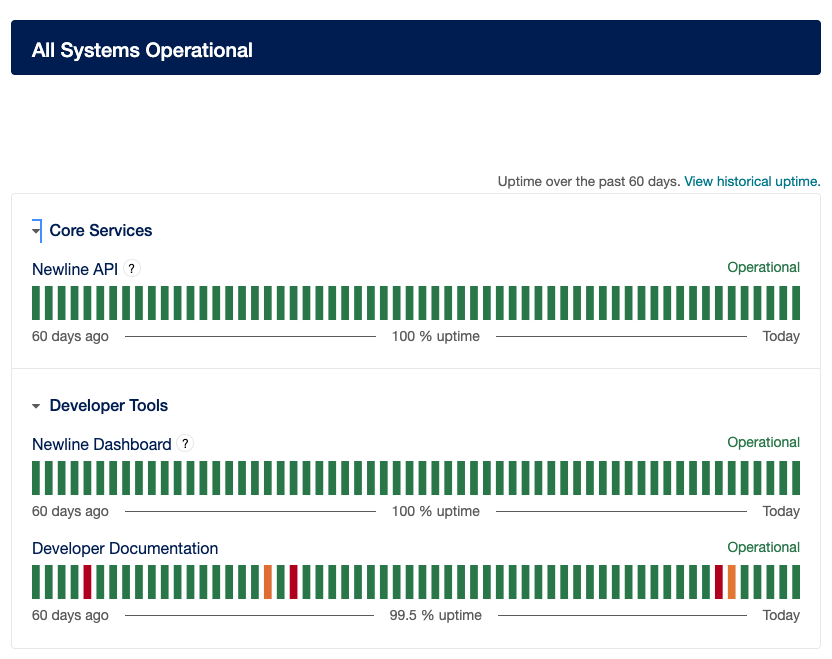
- Service Categories: Core Services and Developer Tools (expand to view individual services)
- Status Indicators: e.g.,
- Green: Operational
- Yellow: Degraded Performance
- Red: Service Outage
Additional Details
- Status page reflects real time updates upon data retrieval
- Status aligns with incident lifecycle events (Scheduled → In Progress → Completed)
- Indicators include descriptive context for each service
Uptime Overview (Past 90 Days)
The main Status Page displays a 90-day uptime summary as a color-coded daily grid.
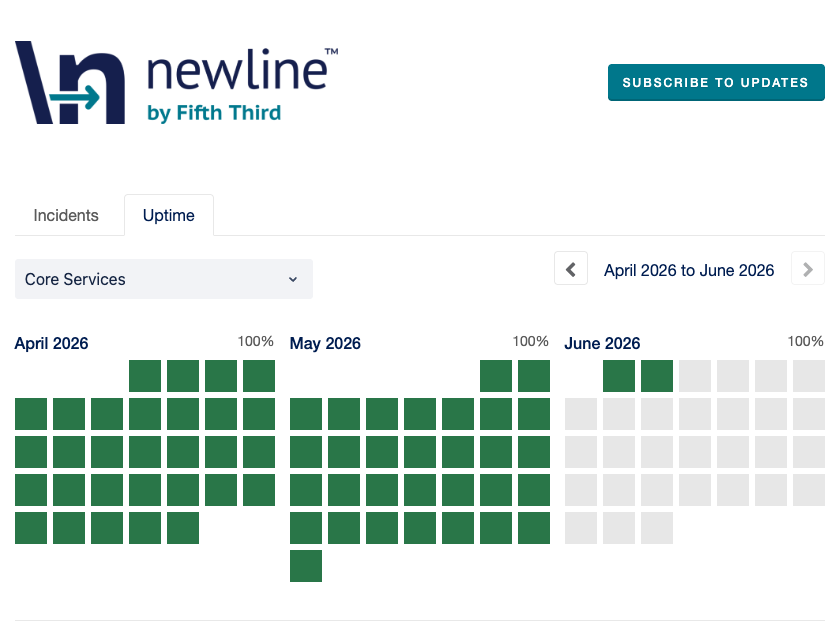
Select "View historical uptime" to open the Historical Uptime page with a 90-day view of system reliability.
Note: The Incident History link in the page footer opens the same page but defaults to the Incidents tab instead of Uptime.
Tabs on the Historical Uptime Page
- Uptime Tab – Shows the 90‑day availability grid for each service
- Incidents Tab – Provides a chronological list of incidents over the same 90‑day period
Data Source
- Calculated from historical incidents and maintenance windows
- Scheduled maintenance is excluded when applicable
Scheduled Maintenance
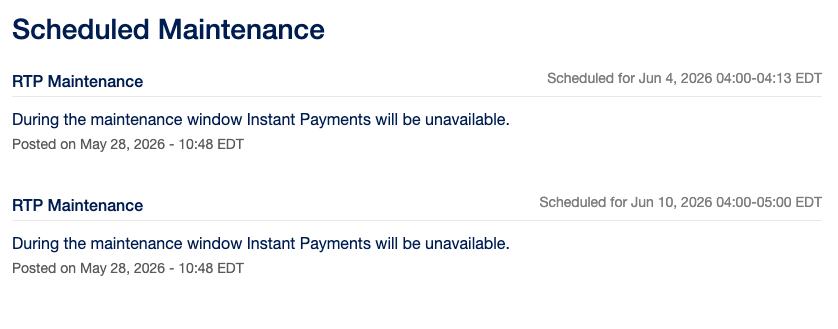
- Maintenance Title: The name of the scheduled maintenance event (e.g., Production Server Patching or RTP Network Maintenance), identifying the affected system or service.
- Impact Summary: A brief description of expected service impact, such as temporary disruptions, degraded performance, or maintenance‑related downtime during the scheduled window.
- Date and Time Posted: The timestamp indicating when the maintenance notice was published, helping users understand how recent the update is.
- Status Lifecycle: The progression of the maintenance event, moving through stages such as Scheduled → In Progress → Completed, showing the current state at a glance.
Status Page Behavior During Maintenance
During an active maintenance window:
- Affected services will reflect real-time status updates (e.g., In Progress)
- Impacted functionality (such as Instant Payments) may be temporarily unavailable
- Entries remain visible throughout the lifecycle and update dynamically as the event progresses
Additional Notes
- Multiple maintenance windows may appear simultaneously
- Each entry links to a detailed timeline
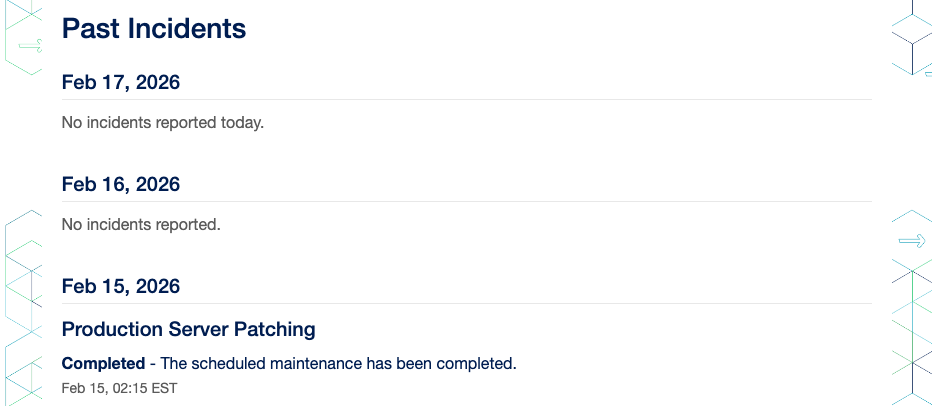
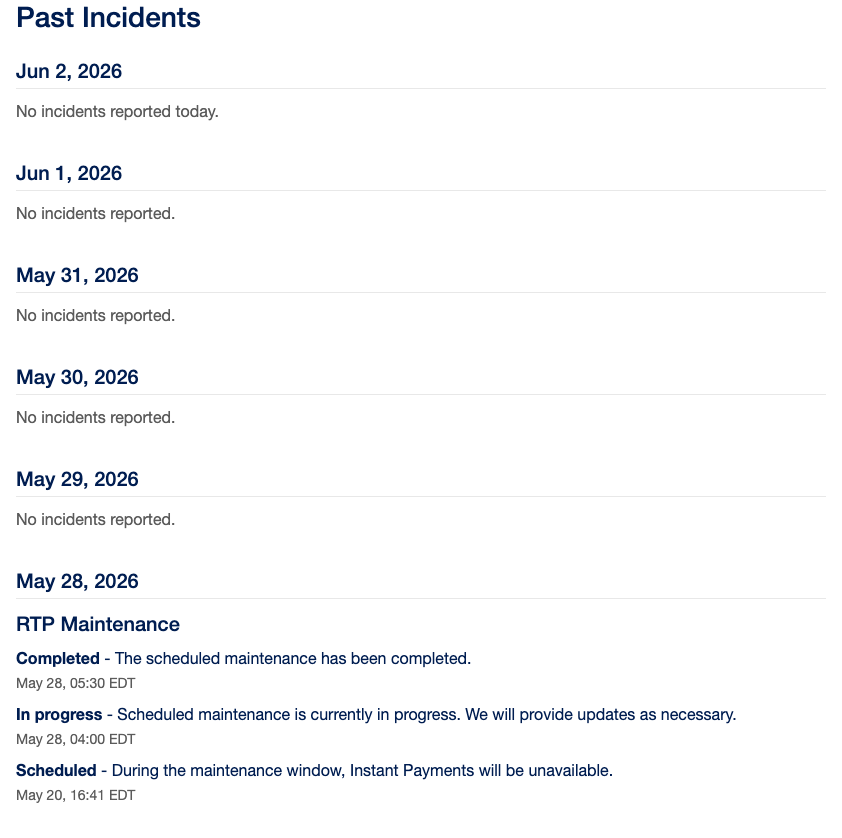
Past Incidents
View a chronological feed of incidents and completed maintenance by date.
For Each Date
-
Daily Status Summary: Each date displays either “No incidents reported” or one or more incident entries, depending on activity for that day.
-
Incident Title: The name of the incident, summarizing what occurred or what service was affected.
-
Lifecycle Updates: Status progression for each incident (e.g., Investigating → Identified → Monitoring → Resolved), showing where the issue stands.
-
Timestamps: Time‑stamped updates that reflect when each lifecycle change or communication occurred.
-
Link to Incident Detail Page: Each incident entry includes a link directing users to the full incident record for deeper context and historical visibility.
Incident Detail Pages Include
-
Summary & Impact Description: A concise explanation of what happened, what services or users were affected, and the severity or scope of the issue.
-
Update History with Timestamps: A chronological log of every update made during the incident, including when each status change occurred and any relevant notes.
-
Final Resolution State: The closure summary documenting how the issue was resolved and the final outcome of the incident.
Incident History
The Incident History link in the footer opens the 90-day Historical Uptime page on the Incidents tab by default. Switch between:
- Incidents Tab
- Uptime Tab
Subscription Options
Click Subscribe to Updates to open the notification channel menu.
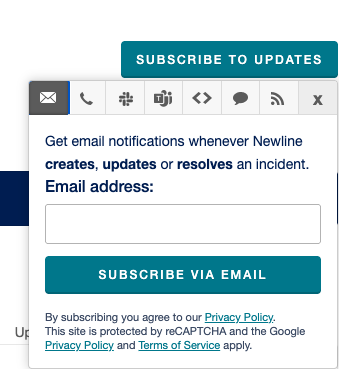
Notification methods are accessed through tabs at the top of the subscription window. Selecting an icon will display the corresponding subscription form or configuration for that channel.
Available Subscription Methods
- Email: Opens a subscription form where users can enter their email address to receive notifications when incidents are created, updated, or resolved. Users confirm their subscription by selecting “Subscribe via Email.”
- SMS/Text: Opens a prompt allowing users to enter their mobile phone number to subscribe to real‑time text message notifications for incidents and maintenance events.
- Slack: Provides a button that users can click to subscribe a Slack channel. This connects their Slack workspace so alerts are automatically posted to the selected channel.
- Microsoft Teams: Opens a configuration view where users provide a Microsoft Teams incoming webhook URL. Once configured, alerts are automatically posted to the selected Teams channel.
- Webhook: Allows users to subscribe using their own custom webhook endpoint, enabling automated system‑to‑system notifications for incidents and maintenance events.
- Atom Feed: Presents a button that directs users to the support site where they can access and subscribe to the Atom feed using their preferred feed reader.
- RSS Feed: Provides a direct link users can click to subscribe via RSS. This option is separate from Atom and allows users to choose whichever format their reader supports.
- X (Close): Closes the subscription window and returns the user to the main Status page without subscribing.
Subscriptions apply to both incidents and scheduled maintenance updates and reflect status changes in real time.
Some subscription methods may include validation steps such as CAPTCHA or agreement to privacy terms before completion.
Updated about 2 months ago