

Reports & Analytics
Overview of Newline Dashboard reporting tools, program metrics, and interactive analytics charts.
The Newline Dashboard includes built-in reporting tools that provide visibility into transaction activity and program performance, helping users monitor trends, analyze activity over time, and support operational and financial review workflows.
Reporting tools are accessible from the Reports tab in the navigation header or through the Reports & Analytics Snapshot on the Home screen.
When to Use Reports & Analytics
Use Reports & Analytics to:
- Monitor transaction volume and activity trends
- Review performance across time periods
- Support operational reviews and program monitoring
- Identify anomalies or changes in transaction patterns
Program Metrics Summary
The Program Metrics Summary provides a high-level snapshot of your program’s activity and performance.
It includes:
-
Total Transactions
The total number of transactions processed across all payment types (ACH, Wire, Card, etc.) -
Settled Amount
The cumulative dollar value of transactions that have successfully completed settlement -
Total Balance
The current balance based on settled transaction activity. -
Returned Transactions
The number of transactions that were returned or rejected due to errors, invalid data, or processing issues
This section is commonly used to:
- Monitor overall activity levels
- Compare performance across time periods
- Quickly identify unusual spikes or drops in activity
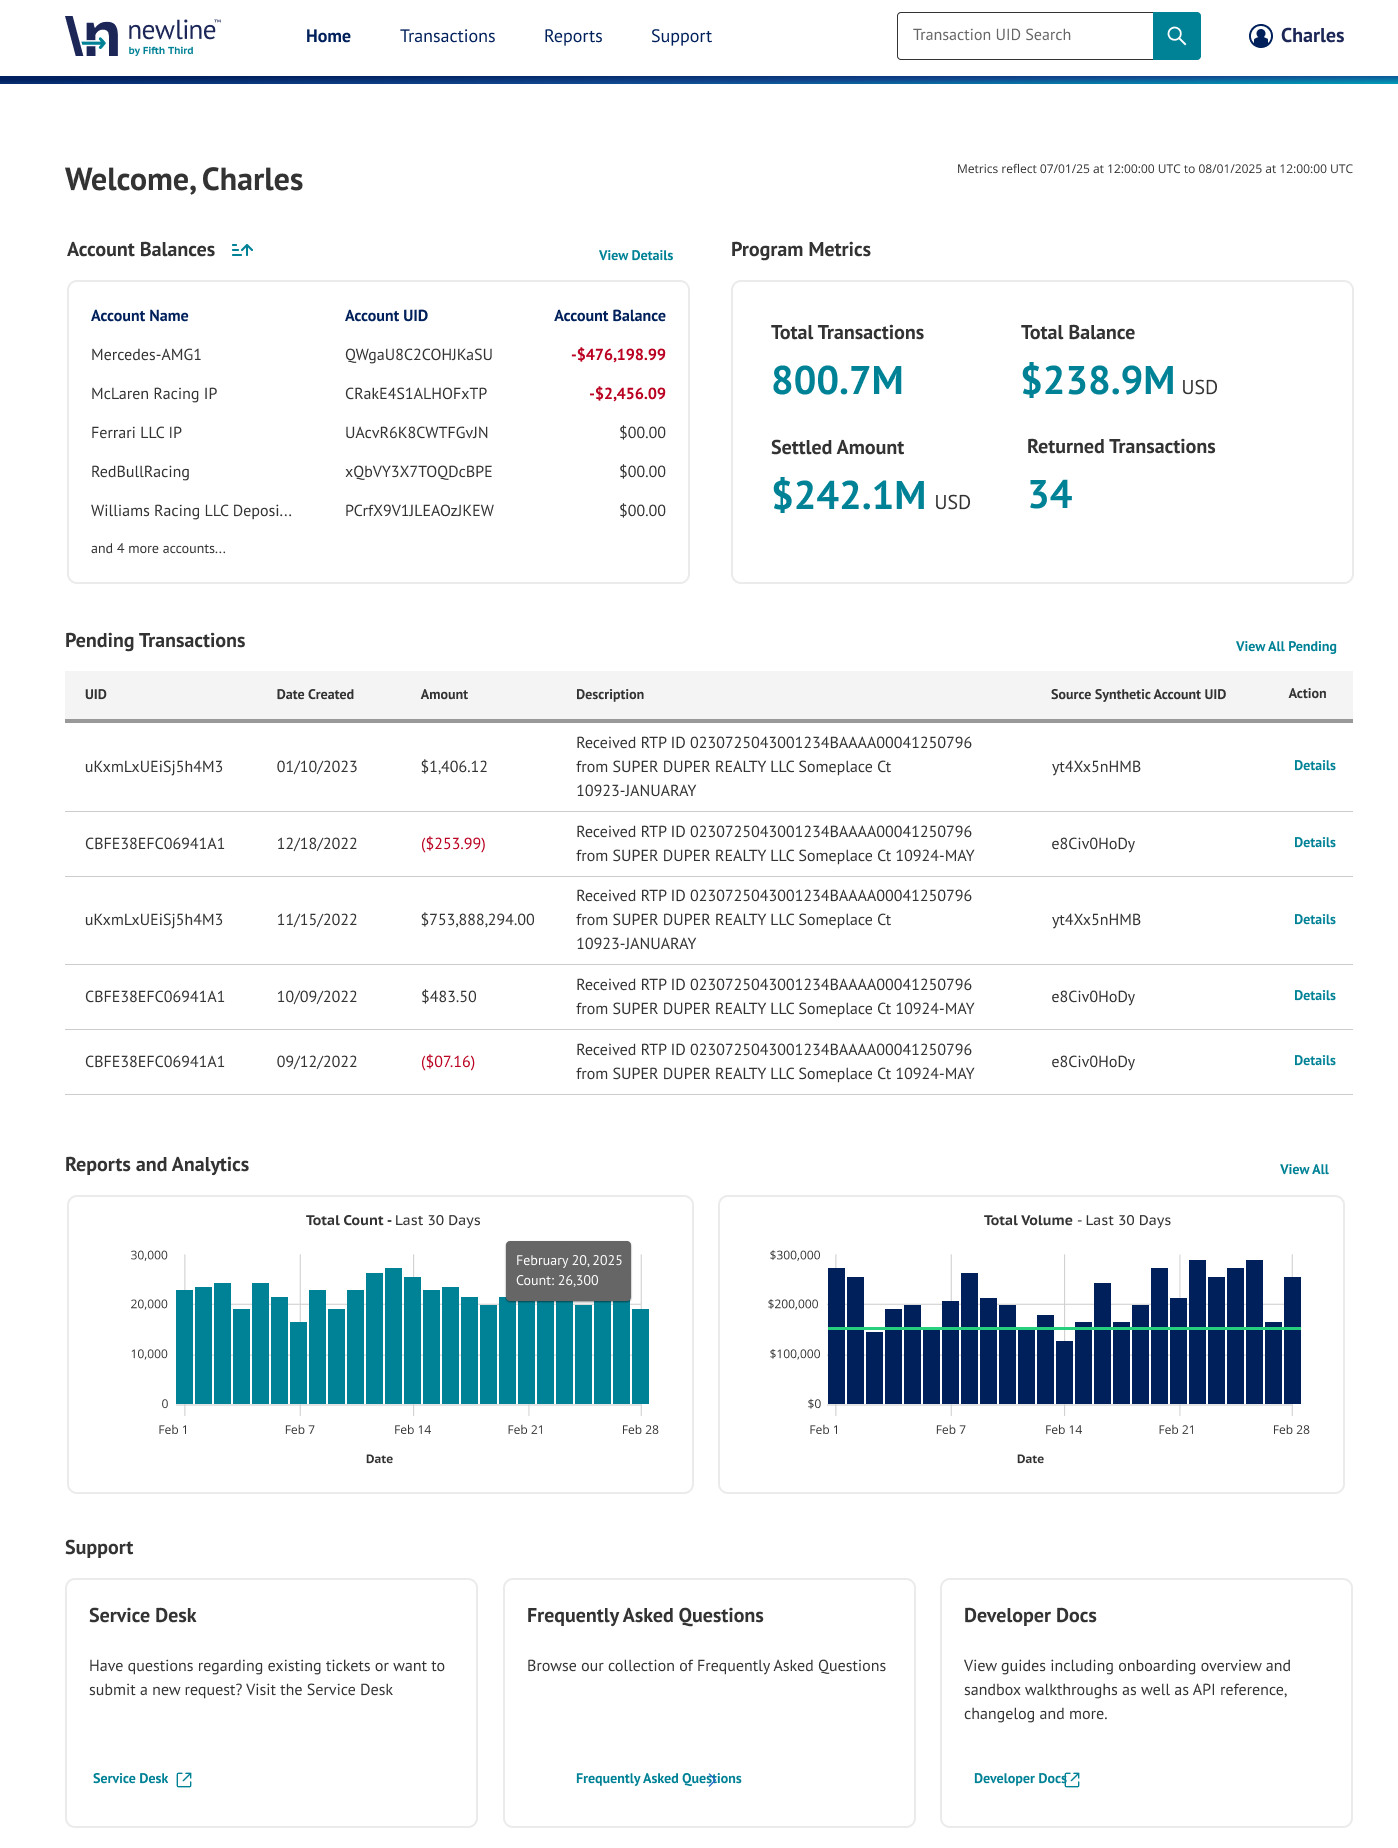
Interactive Charts
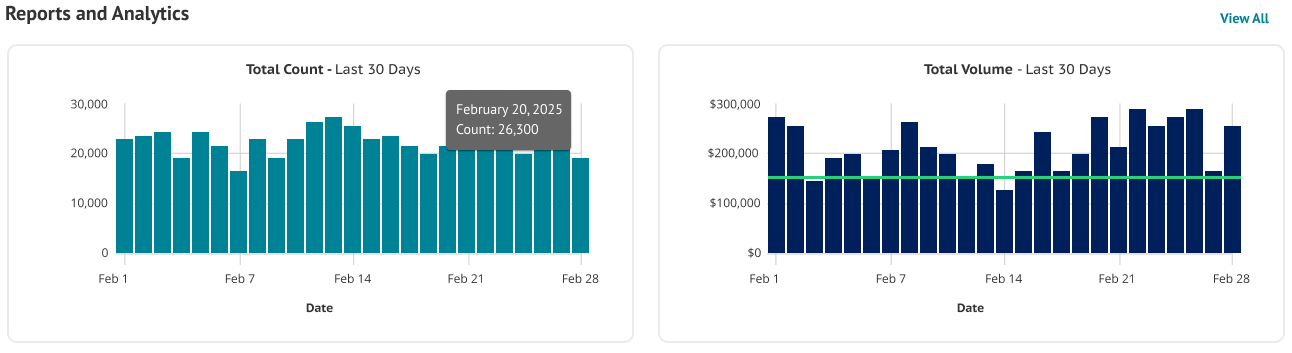
Located in the Reports & Analytics Snapshot on the Home screen, these charts visualize transaction activity over time.
What the Charts Show
- Transaction Volumes and Counts
Interactive charts display the number and volume of transactions over defined time periods (e.g., last 10 and 30 days)
How to Use
Charts are fully interactive:
- Hover over data points to view detailed values
- Compare activity across different time periods
- Identify trends, spikes, or changes in transaction volume
These visualizations are useful for:
- Monitoring short-term trends
- Identifying operational anomalies
- Supporting high-level reporting and analysis
Getting Insights from Reports
Use Dashboard reports to answer questions such as:
- How has transaction volume changed over time?
- Are there unusual increases in returned transactions?
- How does recent activity compare to previous periods?
Important Notes
- Dashboard reports provide aggregated and summarized views of transaction activity
- Dashboard data is intended for monitoring and analysis, not as a system of record for reconciliation
Updated about 1 month ago